Stock Price Variance Research - Additional Details
Our Observations:
We started measuring stock price variance in May 2022. Since then, the variance of daily price changes are elevated, and have recently plateaued. They are now declining. Stock price volatility is declining. This means that on any given day, stocks will move less than before, regardless of whether up or down, however the rate of growth in variance is negative. In other words, stock price variance is decreasing.
We have heard a great deal about market liquidity, and have a hypothesis that changes in liquidity impacted stock price variance. However, we do not know whether liquidity improved in December 2022, and that seems questionable.
Stock price variance is consistently and significantly higher for stocks of companies with negative net income (and may include companies with non-US HQ locations) than for companies with positive net income (and solely US HQ locations). We also see larger overall declines in unprofitable company stocks over the past year.
Higher price variance and larger price declines are significant in our datasets between populations of US-listed unprofitable companies than US-Listed and US HQ companies that make a profit.
The riskiness of the SPY (the S&P 500 Index ETF) is elevated, but is slightly better (lower) than an equally weighted set of all profitable stocks. We understand the hypothesis and anecdotal evidence that market capitalization weighted indices provide better risk-adjusted returns. We believe that the $SPY is providing better variance readings than an equally weighted set of profitable stocks because of that capitalization weighting.
Key Takeaways:
Key Research Question:
Why did stock price variance increase from May 2022 through December 2022, and why did it flatten into May 2023?
While price variance flattened, so did the absolute level of diversified indices. We entered a consolidation phase, or what we affectionately call 'beach chop' where prices rise and fall quickly, but in a small range.
We hypothesize that this is caused by multiple factors, including reduced liquidity, increased costs of investing (e.g., rising interest rates), and a lower cost of making speculative bets on US equities. We also expect that greater use of shorter-term options (0DTE) has an impact on reducing large price movements.
We started measuring stock price variance in May 2022. Since then, the variance of daily price changes are elevated, and have recently plateaued. They are now declining. Stock price volatility is declining. This means that on any given day, stocks will move less than before, regardless of whether up or down, however the rate of growth in variance is negative. In other words, stock price variance is decreasing.
We have heard a great deal about market liquidity, and have a hypothesis that changes in liquidity impacted stock price variance. However, we do not know whether liquidity improved in December 2022, and that seems questionable.
Stock price variance is consistently and significantly higher for stocks of companies with negative net income (and may include companies with non-US HQ locations) than for companies with positive net income (and solely US HQ locations). We also see larger overall declines in unprofitable company stocks over the past year.
Higher price variance and larger price declines are significant in our datasets between populations of US-listed unprofitable companies than US-Listed and US HQ companies that make a profit.
The riskiness of the SPY (the S&P 500 Index ETF) is elevated, but is slightly better (lower) than an equally weighted set of all profitable stocks. We understand the hypothesis and anecdotal evidence that market capitalization weighted indices provide better risk-adjusted returns. We believe that the $SPY is providing better variance readings than an equally weighted set of profitable stocks because of that capitalization weighting.
Key Takeaways:
- We can improve the variance of our portfolios by market capitalization weighting our data analysis, although this has a high computational cost and would reduce our data accuracy. You can gain this benefit by investing with the S&P 500 ETF.
- Invest only in profitable companies with US HQ locations if you want less stock price volatility, all else being equal.
- We have seen a casual relationship between rising stock price variance and falling stock prices. There is no proof of causality.
Key Research Question:
Why did stock price variance increase from May 2022 through December 2022, and why did it flatten into May 2023?
While price variance flattened, so did the absolute level of diversified indices. We entered a consolidation phase, or what we affectionately call 'beach chop' where prices rise and fall quickly, but in a small range.
We hypothesize that this is caused by multiple factors, including reduced liquidity, increased costs of investing (e.g., rising interest rates), and a lower cost of making speculative bets on US equities. We also expect that greater use of shorter-term options (0DTE) has an impact on reducing large price movements.
- Are US-listed stocks more or less volatile currently?
- What is actual US-listed stock price volatility
- What is the actual stock price variance currently?
- Do stock prices have higher or lower volatility over the last six months?
- What does it mean for investors if U.S. stock prices have lower volatility?
One way to measure the riskiness of US-listed stocks is to measure the variance of stock price changes. Risk is a function of stock price variance, which is the degree which stock prices vary around their mean change. We believe that risky stocks with high variance require investors to demand a higher expected return to hold them. The high uncertainty presented by higher variance requires a higher expected return.
When stock price variance falls across all stocks, and for the major indices, then the expected return required by investors falls. At least, that is what the theory says.
We calculate variance based on daily, adjusted price changes over the past 253 trading days. Stocks that maintain a stable price or stocks that rise (or fall) steadily have lower variance than stocks that fluctuate aggressively. We used to calculate price variance off of a natural log, and recently transitioned to a power log (upon request). This makes our variance values smaller, but still comparable across stocks.
This is counter-intuitive in practice. As stock price variance rises, we expect to see stock prices fall, which increases expected returns for new investments.
There are many experimental questions and hypotheses around this topic:
1. What causes increased stock price variance?
2. Is there a linkage (and possibly a lag) between rising stock price variance and falling stock prices?
3. Do we see differences in stock price variance across stock populations?
4. Do indices provide significant protection against stock price variance?
We have additional data to what is reported here. For collaboration opportunities please direct message us.
Update in September 2023:
We have continued to measure and analyze stock price variance this whole time. We have seen a continued decline in both the number of stocks trading each day (down around 10%), and a significant and steady decline in stock market variance in both the S&P 500 equity index ETF and in the full portfolio of stocks analyzed each day.
We see supporting evidence in the VIX, or the volatility index, which has recently traded in the 13 handle range (which reflects a low price for protection against volatility).
The securities tied to volatility have significant negative BETA values, which continues to support the notion that as market risk falls, the price of equities can and often does rise. Hope this was helpful.
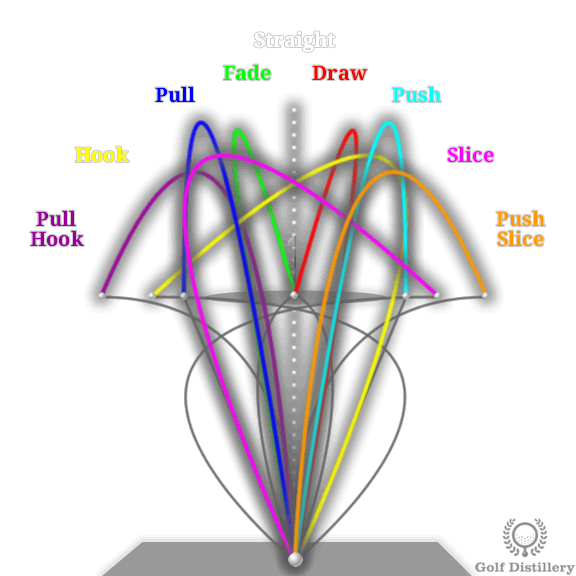
Analogy for variance. Trajectory and movement off the trend line.
If you throw a baseball or football to your friend, when does it stop moving up or down? Same with hitting a golf ball. When does it find its peaceful, calm moment? There are three times when the ball is not moving up or down.
1. Before you throw or hit it
2. After your friend catches it, or it stops rolling.
3. At the peak of the throw or ball's flight (regardless of the shape of the curve - it usually hits a d(y)/d(t) = 0.
It is possible that the markets are reaching a level where overall valuations are stabilizing (either at a high, a low, or just a fair value that holds for more than a moment).